ProfessionalinstrumentMarket events — in a single screener/chaos
Scroll to see how RedScalp picks out events ↓
Exchange market screener
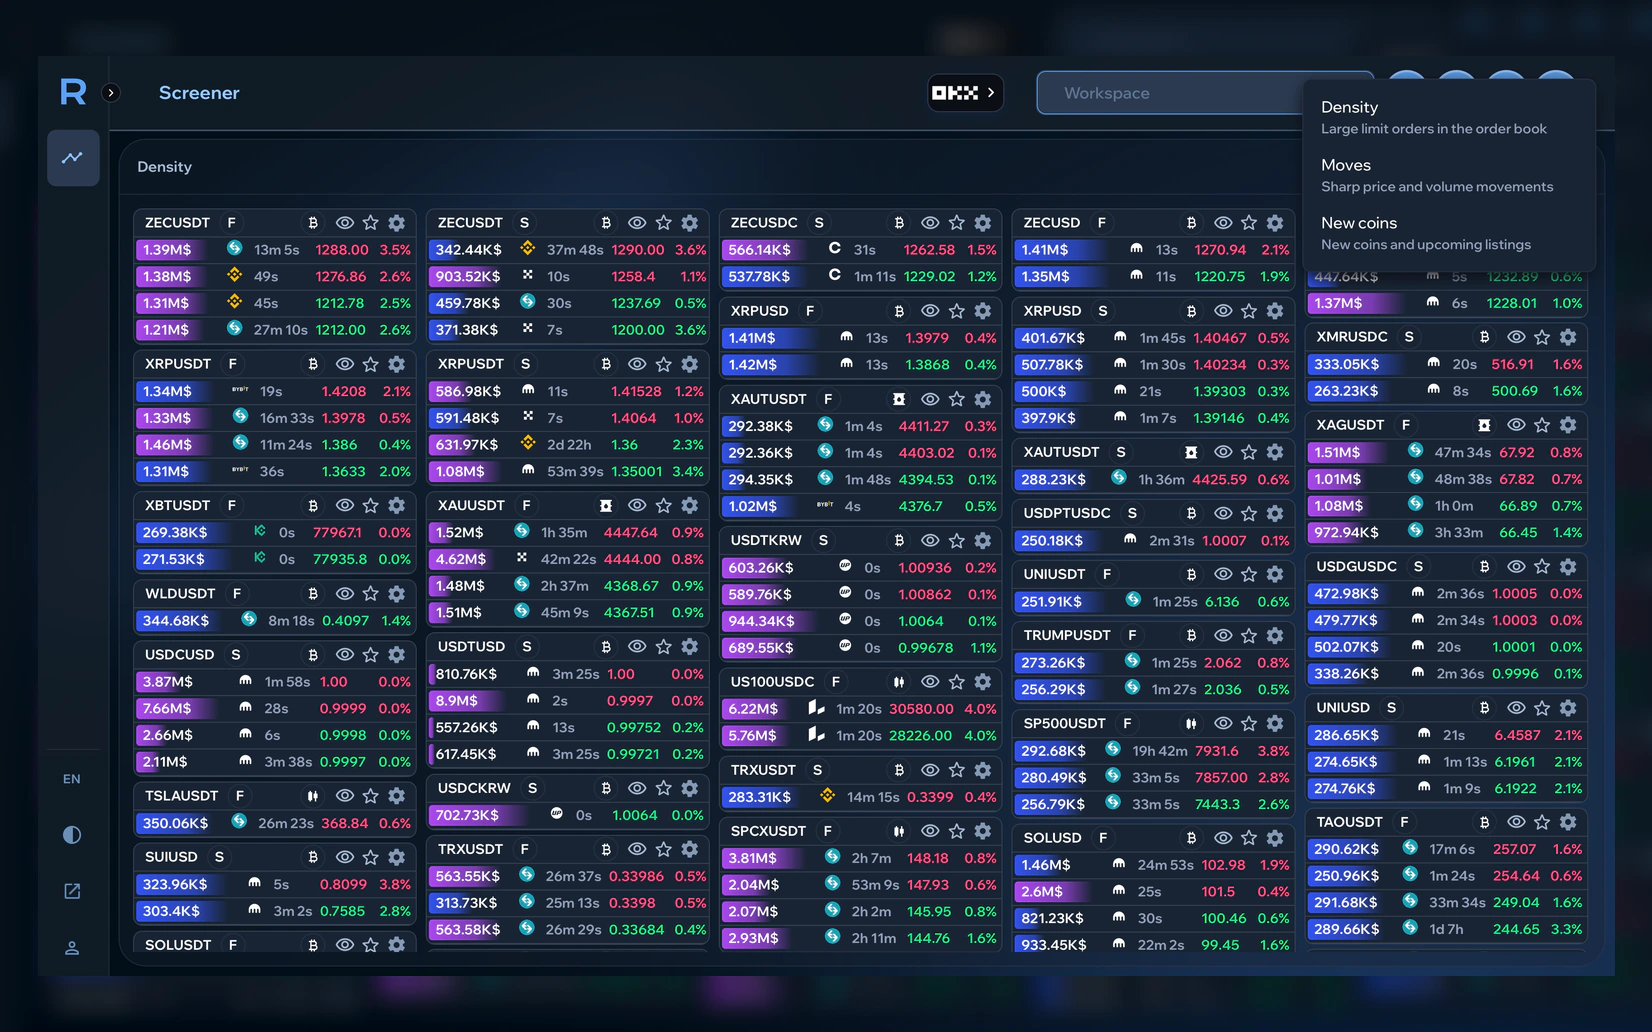
RedScalp is a crypto screener for picking out events across exchange markets. One workspace brings together order-book density, price and volume moves, new coins and upcoming listings.
How the screener works
Instead of scanning a long list of pairs by hand, the screener surfaces events that match the conditions you set. Initial filtering draws on exchange data, Spot and Futures markets and each widget's own filters.
RedScalp gives no trading advice. It shortens the path from the broad market to an instrument worth a closer look: match the event against market context and decide for yourself.
Three screener widgets
Density, moves and new coins live in one crypto screener. Pick the kind of event you need and move from the broad market to a specific instrument.
Three RedScalp screener widgetsWhat the widgets show
The Density widget shows large limit orders and order-book levels. Moves picks out notable price and volume changes over a chosen interval.
New Coins shows upcoming listings with the exchange, market type, trading start time and a countdown. Every widget can be tuned to your own watch conditions.
Build your working screen
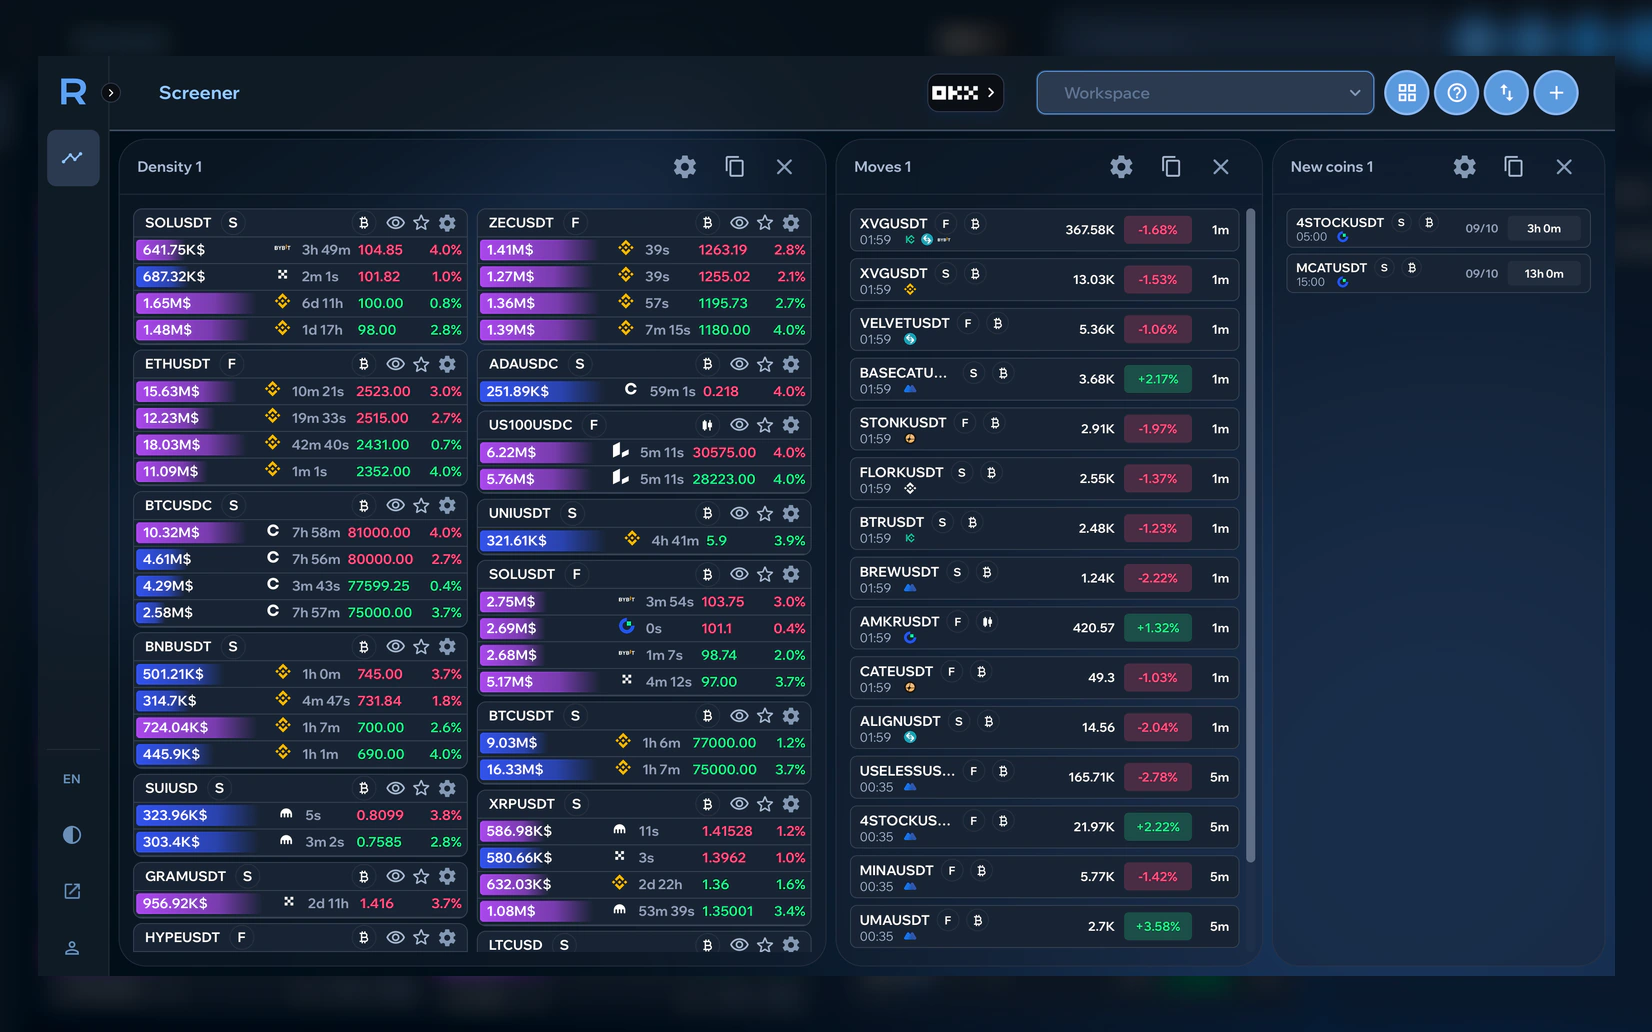
Create separate workspaces, add the widgets you need and change their size and position. Only the slice of the market you need right now stays on screen.
A RedScalp workspace with the Density widgetHow workspaces work
Different tasks can get their own layouts: split Spot and Futures, exchanges or event types. Widget positions, sizes and settings are saved with your workspace.
Auto-alignment tidies the grid in one step, while JSON import and export moves a prepared layout elsewhere or keeps a copy of it.
Price and volume moves
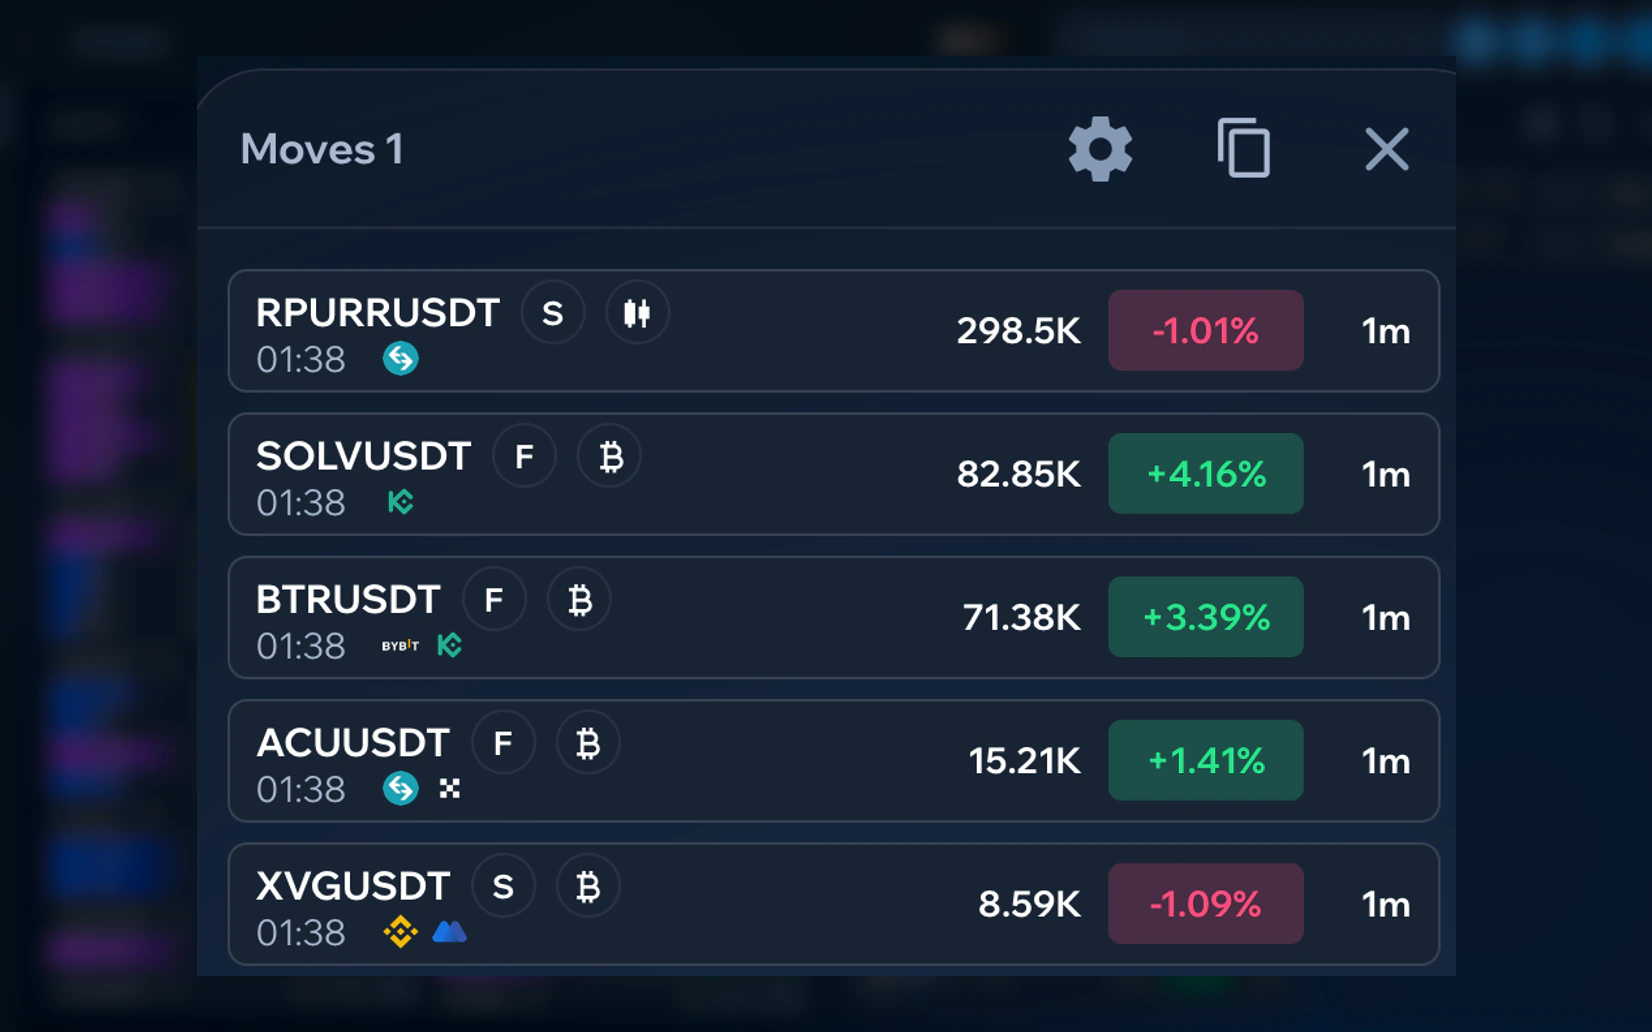
The Moves widget highlights pairs with a notable price change over the chosen interval. Direction, percentage and volume give context for a quick pass.
Price and volume moves over selected intervalsHow to read moves
Each event row shows the symbol, Spot or Futures, exchange, volume, percentage change and interval. Filters narrow it down to the markets and change thresholds you care about.
Settings include alerts for selected events, so you needn't keep every pair in view. A move predicts nothing about what price does next — whatever you find still needs checking yourself.
Order-book density
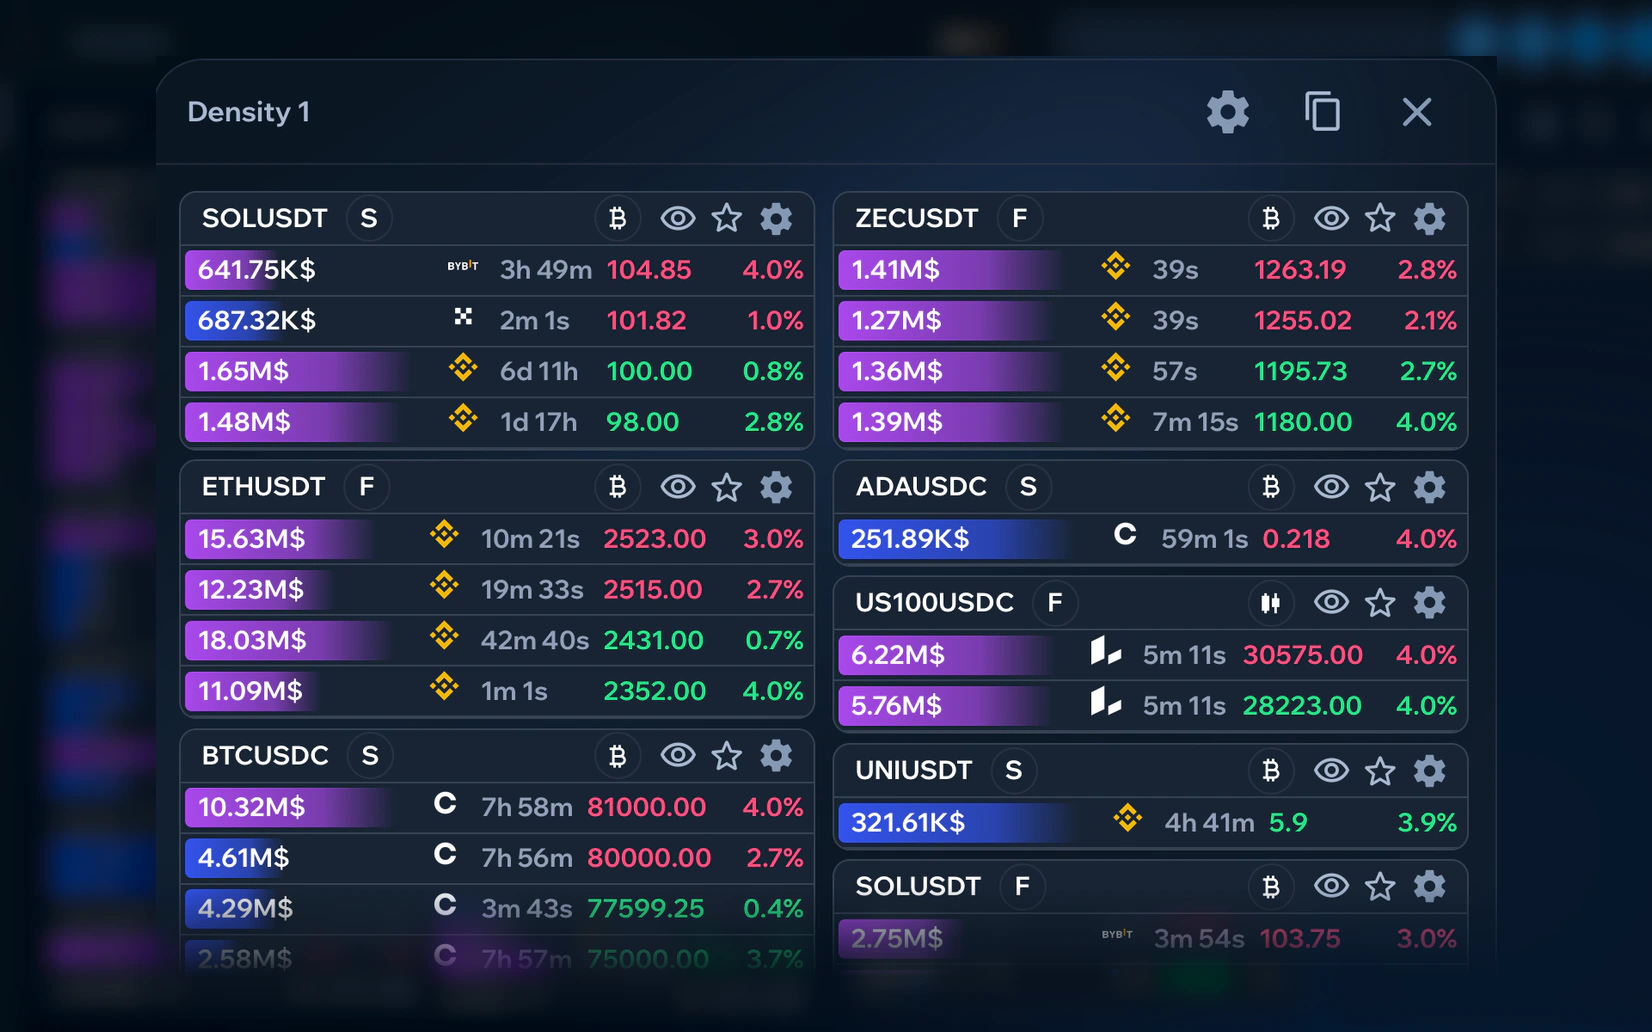
Find large limit orders without reading every order book by hand. Compare volume, level price, book side, distance to market and how long the density has lived.
Order-book density: volume, price, distance and order lifetimeHow to read density
Density settings cover exchanges, Spot and Futures, minimum volume, distance range from the current price, lifetime, individual symbols and sorting.
A limit order can change or vanish before it is filled. Density is therefore market context for further analysis, not a ready-made trading signal.
Open RedScalp
Pick a workspace, add the widgets you need and set filters by exchange and market type. RedScalp helps you start the analysis from the market events that matter.